At the end of the day you can see the total revenue.
It’s important information.
But it doesn’t answer every question.
Which products are ordered most often?
On which days do you get the most orders?
What is the average value of an order?
Are there dishes that take up space on the menu but are ordered very rarely?
A digital system can turn orders into information that is easier to analyze.
Not just how much you sold, but what you sold
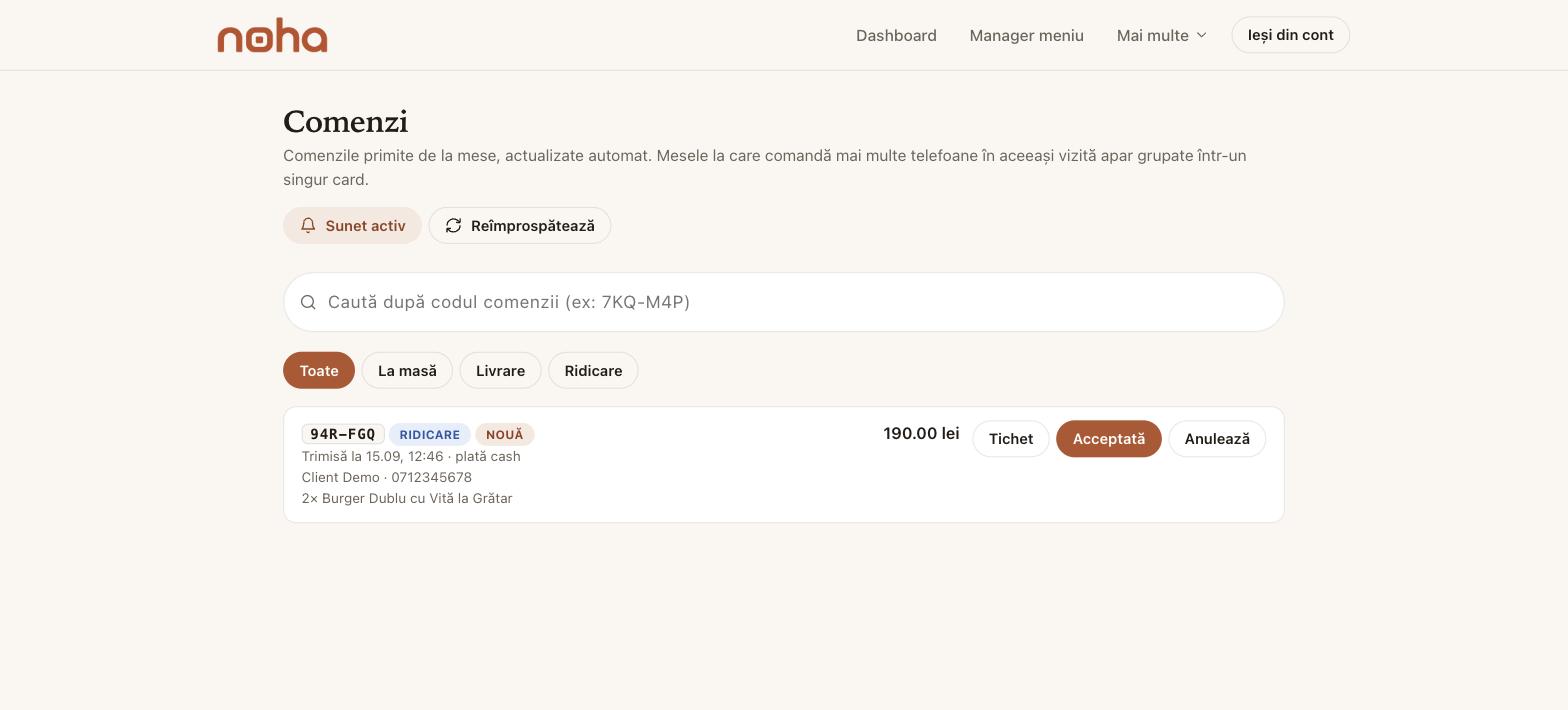
Orders that go through the Noha system can generate data about customer behavior.
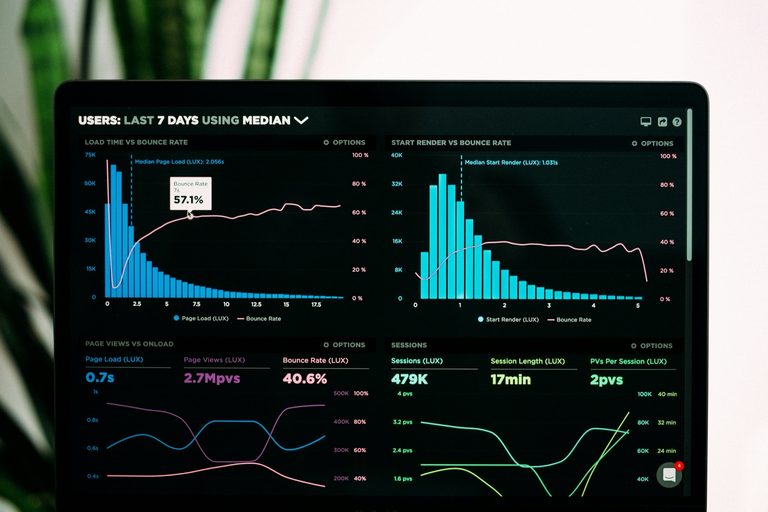
Instead of seeing only the total amount, you can track indicators such as the number of orders, revenue trends or popular products.
Analysis over different periods can help identify trends.
You discover the products that work
Some products may turn out to be much more popular than you expected.
Others may get very few orders.
This information can influence how you build the menu, promotions or recommendations.
You can analyze the evolution
A single day can be atypical.
That’s why it’s more relevant to observe behavior over longer periods.
7 days.
30 days.
90 days.
As data accumulates, it becomes easier to see patterns and compare periods.
Decisions based on what customers do
Intuition remains important in running a restaurant.
But it is much more useful when it is complemented by real data.
A digital menu shouldn’t only present products. It can also become a source of information about how they are bought.